Pictograms and quantities
The plan helps teams locate their work. Statuses and completed and remaining quantities support production tracking by element type.

From pile installation to certification, on the site plan.
Each solar project has its own structure and workflow. EPC Tracker tracks piles, structures and modules on a pictogram, connecting field reports with quality acceptance and the valuation of order items.
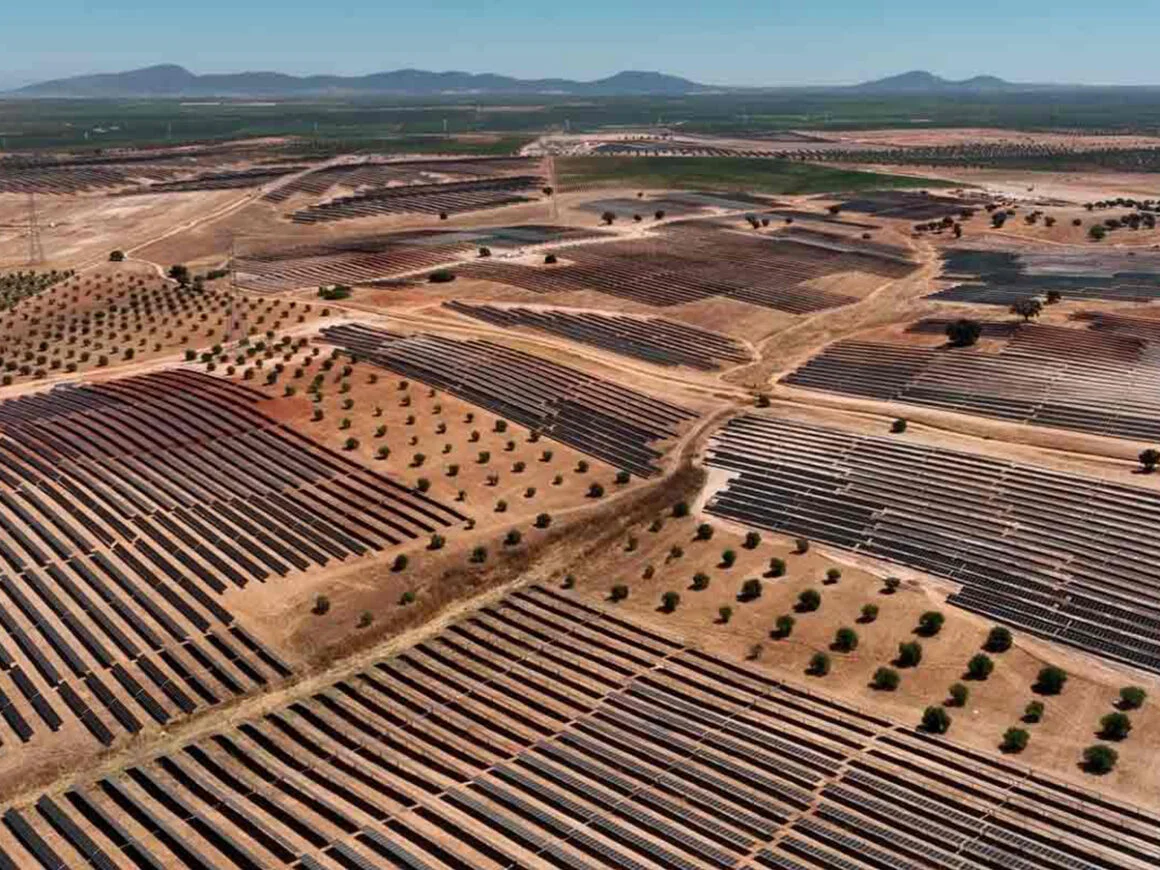
Use the pictogram view to select elements in the relevant block.
Assign an execution status to the selected elements according to the defined workflow.
Retain the record and review the new status, its history and updated quantities.
Relate field reporting to quality review and quantities associated with the order items.
The plan helps teams locate their work. Statuses and completed and remaining quantities support production tracking by element type.
Distinguish execution reporting from its review. Status, history and evidence provide context for construction and quality teams.
Solar construction is one example of how EPC Tracker can be adapted. The platform also supports the industrial, infrastructure and public works processes presented on the website.
The website demonstration shows piles and explains the tracking of structures and modules. The pictogram structure is defined for each project.
Yes. The solar app example shows element selection and status recording, with updated completed and remaining quantities.
No. The animations recreate the workflow using simplified plans and example quantities. Reference projects are identified separately in the experience section.
We will look at elements, statuses and the workflow between production, quality and certification.
Or email us at
info@epc-tracker.com